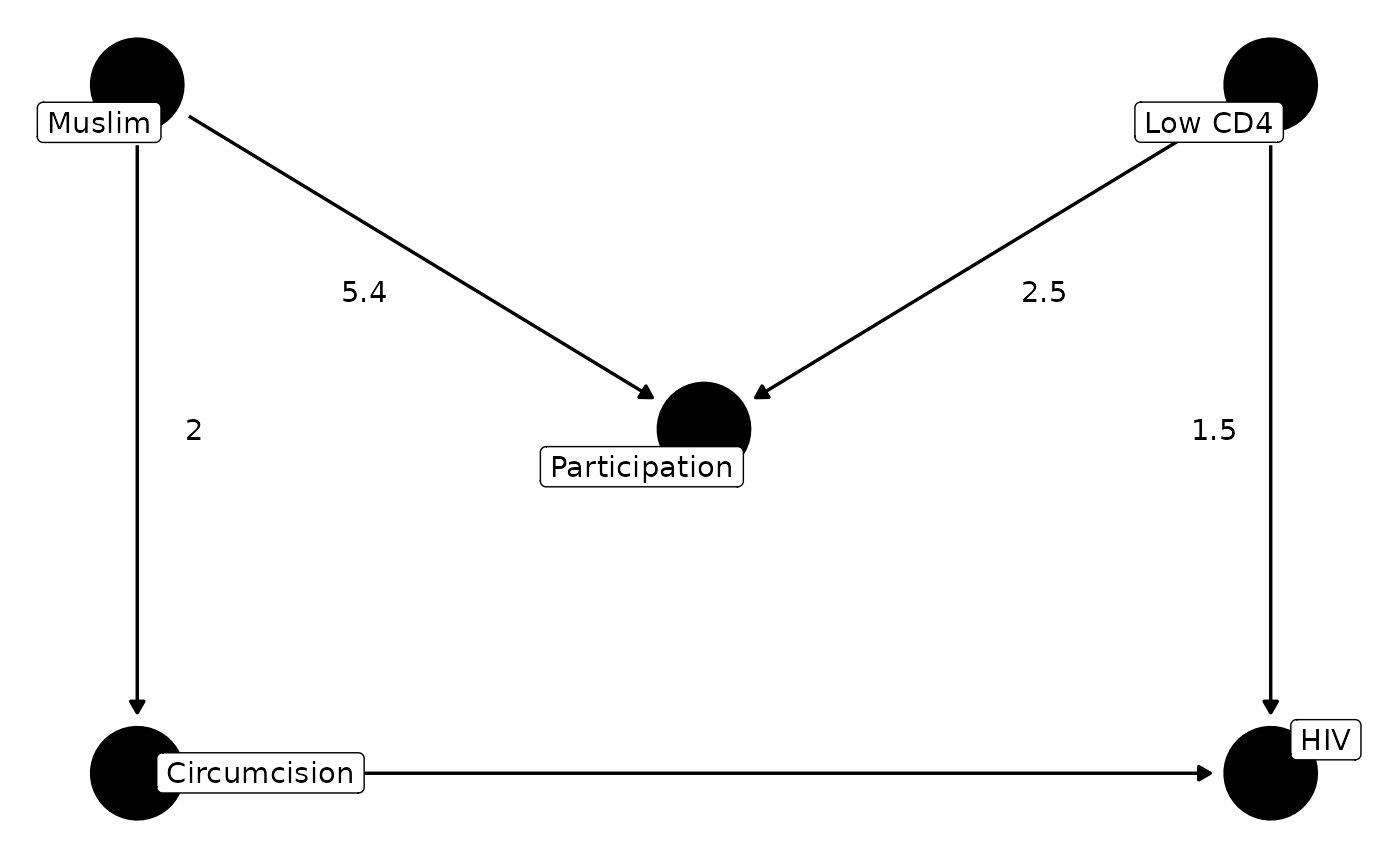
Create two Directed Acyclic Graphs (DAGs), before and after conditioning on the collider M, for selection bias caused by M bias, using 'ggdag'.
Arguments
- x
'mbias' object to plot.
- type
DAG before or after conditioning on M.
- dec
Number of digits displayed.
- ...
Other unused arguments.