
Workflow for Epidemiological Data Analysis
We saw R is a powerful software for data analysis. Contrary to other softwares
which provide you with ready, fixed, canned procedures to perform statistical
analyses, R always let you have access to all computations' results. R can also be
extended with packages. About 6,000 of them are available via
CRAN. Furthermore, you can easily
create your own packages, or functions, to tackle your specific needs and/or
problems.
Specifically for epidemiologist, you could use the following packages for your analyses:
- Epi (DAN)
- epibasix (CAN)
- epicalc (THA)
- epiR (NZE, vet)
- epitools (USA)
- EpiContactTrace (SWE)
- EpiEstim (UK)
- EpiModel (USA)
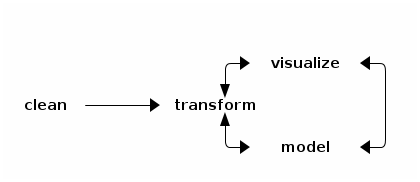
Before using these packages you might well go through these series of steps : cleaning, transforming, visualizing, and modeling your data (from Hadley Wickham).
But first in order to create, manipulate, and make some operations on your data. You will work with R objects.
Tidying Your Data
You will need to get your data in a certain format to be analyzed so that it is
easy to analyzed, visualize, and model. Three tools can help you in your task:
reshape2, stringr, and plyr.
Transforming Your Data
You will need to transform your data to get the output you want. Very often it can be summarized like this: you split your data into the piece you're interested in, apply a function on them, and then combine them back together.